- Open a web element, image, or video with recorded eye tracking data.
- You can switch between four visualization types (heatmap, view path, attention map, scroll map) by clicking the tabs above the eye tracking element. The “Screenshot” tab shows the visualization completely without eye tracking data.
- Clicking on the cogwheel, gives you the possibility to edit the size, transparency etc. depending on the visualization type.
![]()
- Screenshots of the website visits are saved for each subject. The results of all subjects on the same page are visualized together.
- The longest screenshot is automatically selected as background, i.e. the screenshot of the subject who scrolled down the farthest (this screenshot is highlighted in light green if it is not selected).
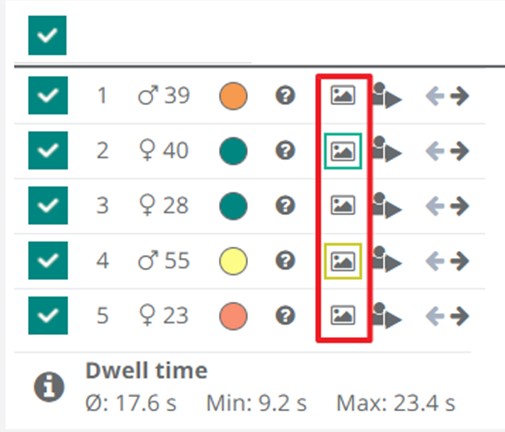
- You can manually select screenshots of other subjects so that they are displayed as the background for the visualizations (this screenshot is highlighted in dark green).
- The animation of the eye tracking data can be played under the screenshot. You can choose to play all subjects at once or only one specific subject.