We use our mouse more than half of the time we spend on the computer – to scroll, to navigate or to click on a button. Mouse activity is used to gather valuable usability data that can tell us a lot about user behavior.
Mouse tracking records at which point in time the cursor is located where on the screen. The EYEVIDO software offers various visualization options and allows for easy analysis. The results can be displayed for individual or multiple users.
EYEVIDO Lab records mouse data in the background during a user study. This process is invisible to the testers. The natural behavior remains unaffected and can be analyzed in the dashboard.
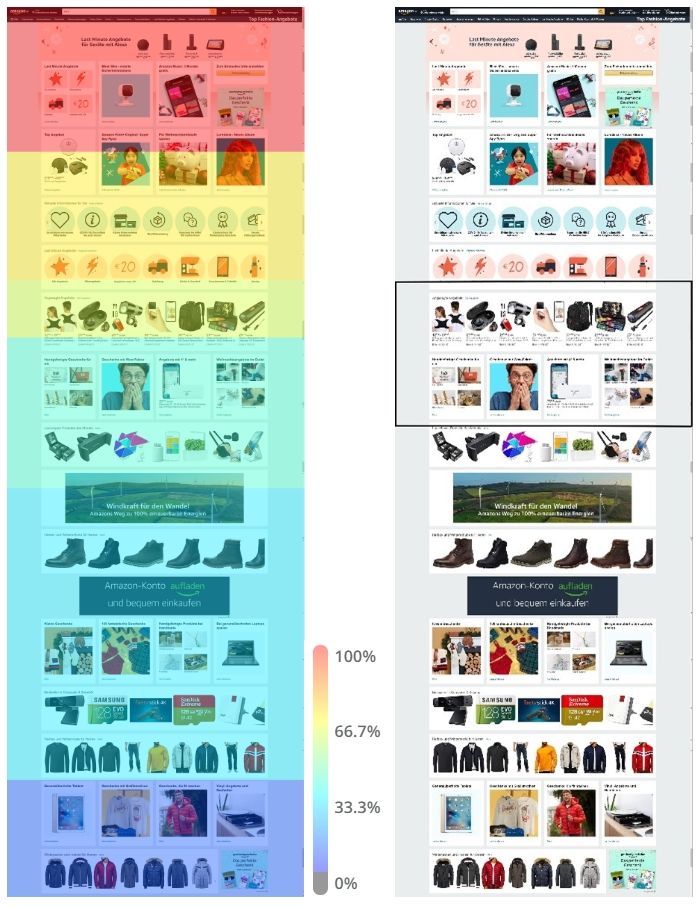
A scroll map is a type of webpage heatmap that visually shows how far users scroll down a webpage. Scroll maps can be captured on websites and apps. Colors and percentages are used to show the most and least viewed parts of a webpage, from hot (100% viewed) to cold (0% viewed).
Alternatively, the scroll lmap in EYEVIDO Lab can also display a heatmap based on the amount of time users have spent in an area of the website.
The EYEVIDO Lab software creates a scroll map for every visited page, that can be display each user individually or as a group.
For individual users, the “viewport” function can be used to track exactly which part of the web page is displayed on the user’s screen while scrolling.
The “fold” is the term for the area below the screen. In other words, the areas of the website that can only be seen by scrolling. During your analysis with EYEVIDO Lab, the fold can be displayed as a dashed line.
Scroll maps provide an overall view of seen parts of the webpage and complement eye tracking data. Areas that have never been shown do not contain mouse or gaze data. Eye tracking and mouse data can be used to analyze details within a viewed area.
Mouse tracking can be used to analyze the “real” behavior of users. The data provides insight into natural behavior and can help optimize conversion rates and uncover usability issues.
Discover what most users click on and what element triggers rage clicks. Rage clicks are referred to clicks on a specific area or element of your website over a short period. This usually happens when action is expected but it doesn’t occur.
Questions like “How many of my users scroll below the fold?”, or “Where do my users click for more information?” can be answered with mouse tracking.